Analytics and control
See where money goes and compare periods side by side, with charts that never rely on colour alone.
Download, it’s free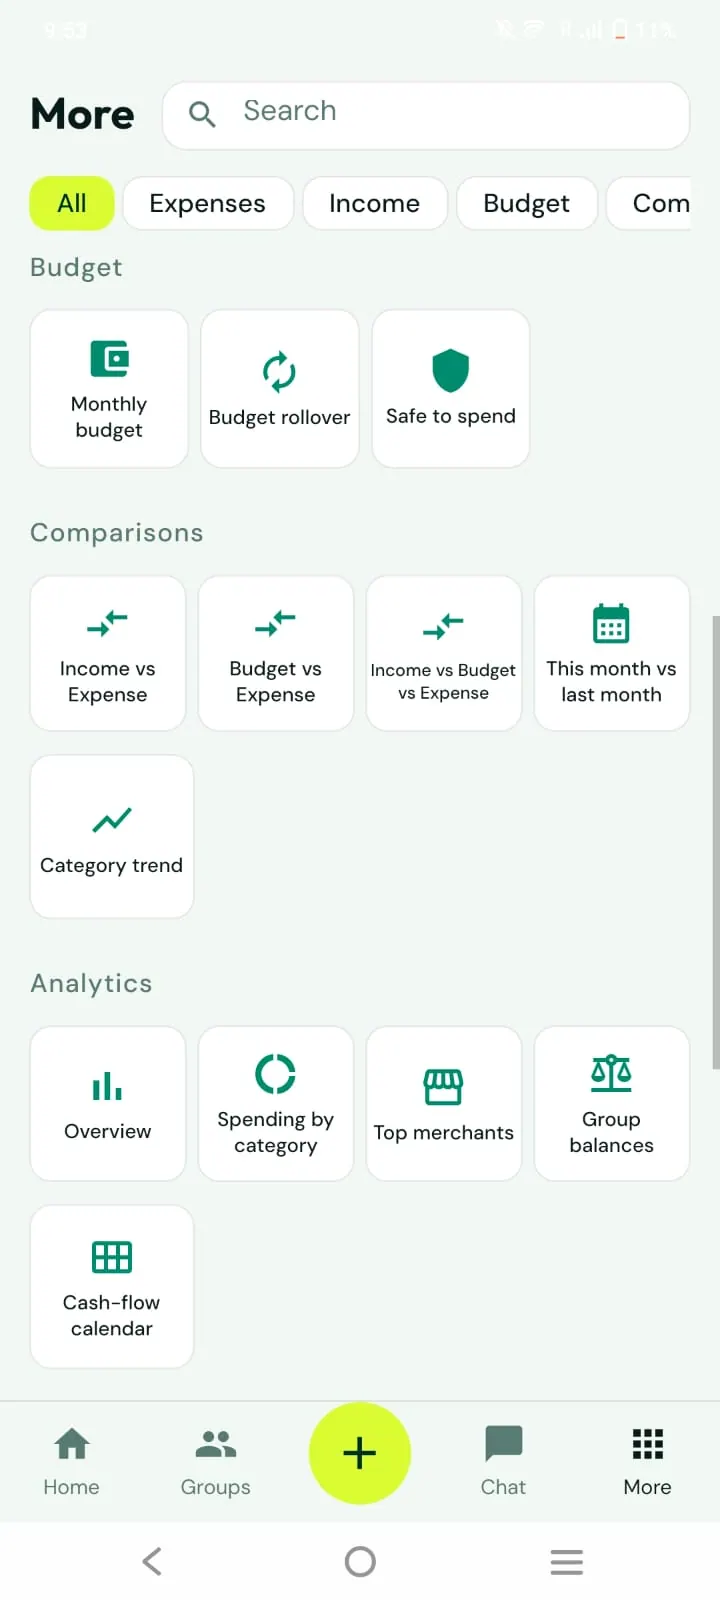
What you can do
Overview, spending by category and top merchants
Cash-flow calendar
Group balances overview
This month vs last, category trend
Income vs expense, budget vs expense, and income vs budget vs expense
How it works
1
Open Analytics
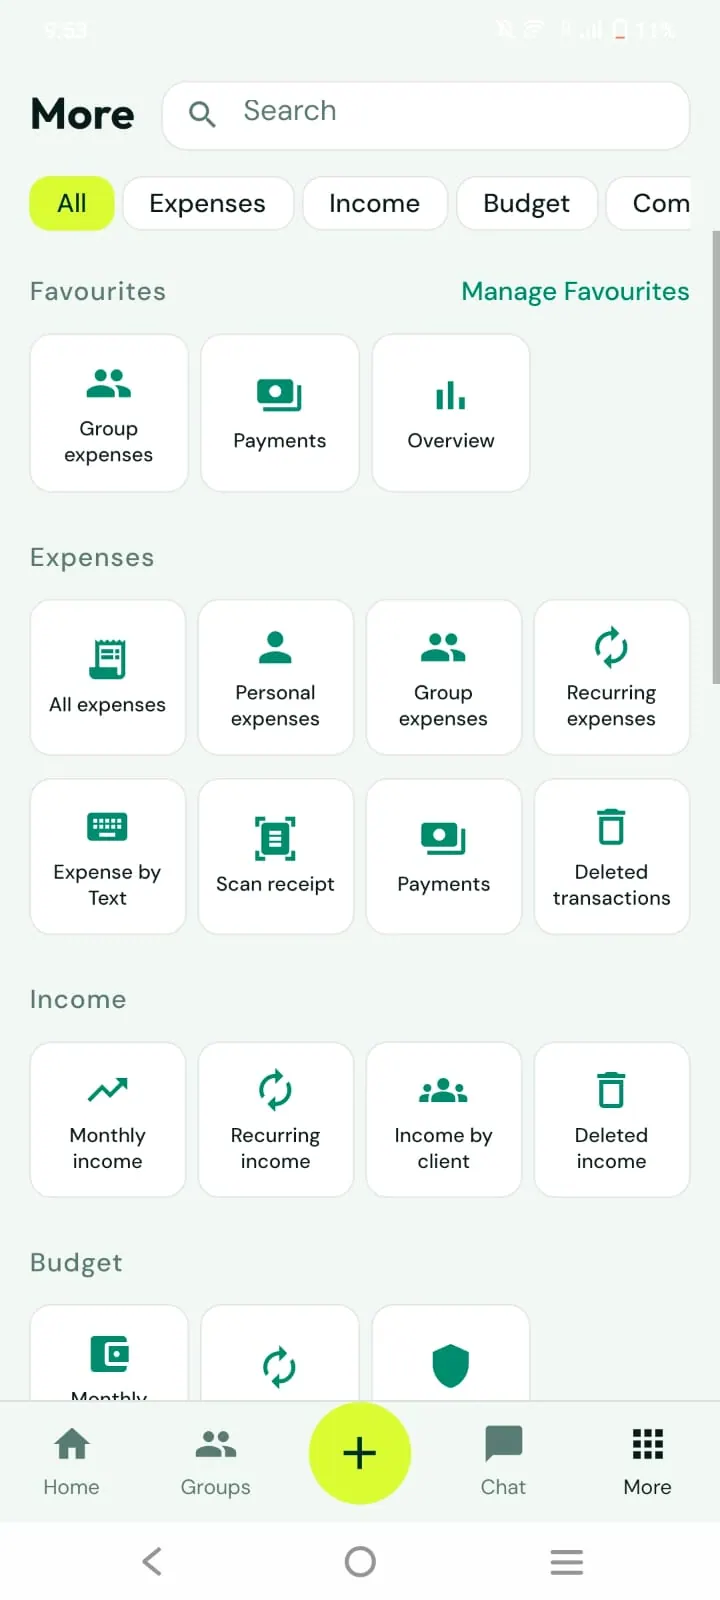
Find it in the More tab.
2
Choose a scope
All, personal or shared.
3
Compare
Switch between the five comparison views.
Good to know
Numbers come from approved entries only.